


Commuter Purchases Define Waterfront Retail Value
Completed purchases during train-linked shopping windows are the clearest starting point for assessing commuters’ value to Ossining’s waterfront retailers. Treating point-of-sale register closures as a foundational measurement principle—rather than an already established local economic fact, protects shopkeepers within the Ossining business community from basing staffing or inventory budgets on foot-traffic illusions. A busy train platform demonstrates transit demand. A closed register receipt demonstrates retail capture.
For merchants operating near the shoreline, the central analytical question is straightforward: how does daily movement through Ossining’s Metro-North station area translate into actual store visits and completed transactions at waterfront businesses? Answering this requires looking past raw commuter volume. When a Hudson Line train doors open, hundreds of passengers exit via the Secor Road and Main Street station access points. Those exits sit within walk-time intervals of around 3 to 8 minutes from the adjacent waterfront commercial blocks. Yet proximity alone never guarantees commercial exchange.
Station activity by itself cannot establish retail benefit for surrounding merchants. Many arriving rail travelers walk straight to parked cars in commuter lots, board connecting Haverstraw-Ossining ferry boats, or head directly home without breaking stride. Conversely, customers dining or shopping along the shoreline during early evening hours frequently arrive by private vehicle or stroll down from residential neighborhoods completely independent of rail service. To build a reliable baseline evaluation window, analysts can use roughly 4 to 6 consecutive weeks of weekday trading logs to establish a pre-intervention standard before drawing any conclusions about transit-driven revenue.
Chamber Programs & Advocacy Metric: Anchor waterfront retail evaluations on completed register transactions during train-linked windows rather than gross platform exit counts, separating verified storefront capture from pass-through transit volume.
Which Waterfront Shops and Trips Count?
A baker on lower Main Street faces a very different pedestrian reality than a retailer located up the hill near Highland Avenue. Because Ossining’s geography rises sharply moving east from the Hudson River, a valid study design must establish a reproducible retail boundary around the immediate station-to-waterfront walking routes. Rather than drawing an arbitrary circle on a map or treating all village businesses as waterfront retailers, the measurement protocol uses a strict topographical exclusion boundary separating flat waterfront commercial blocks from steep upland Ossining downtown streets.
In practice, any formal evaluation report must explicitly name the included street segments and participating storefronts. The reproducible corridor follows continuous walking routes spanning close to 150 to 400 meters from the station overpass to the waterfront commercial perimeter, specifically encompassing lower Main Street, Westerly Road, and the Quimby Street access lanes. Beyond this perimeter, steep elevation gains alter pedestrian behavior and belong in separate upland market analyses.
Within this defined corridor, observers must carefully separate four distinct groups of people:
- Regular rail commuters: Travelers making recurring workday trips via Metro-North who pass through the waterfront district before boarding or after alighting.
- Other rail passengers: Occasional leisure riders, day-trippers, or visitors arriving by train for recreational shoreline visits or signature Ossining events.
- Independent waterfront visitors: Local residents, park visitors, and regional drivers who reach the riverfront without setting foot on a train.
- Unclassified customers: Shoppers whose travel purpose and mode of arrival remain unknown.
Field counters and shop clerks must never classify commuters based on business attire, briefcases, age, or walking direction. Visual profiling introduces severe observer bias, especially given flexible work dress codes and reverse-commuting patterns. Instead, participating shops can test an optional, anonymous checkout question: a single 3-to-5-second verbal prompt asking whether today’s purchase accompanies a train trip.
Even this direct method carries clear methodological limits. Self-reported checkout attribution degrades during high-volume counter rushes when clerks bypass verbal prompts to clear queues exceeding three waiting customers, and shoppers remain free to decline an answer. Consequently, survey tallies represent a minimum confirmed floor of commuter activity rather than an exhaustive census.
From Train Arrivals to Storefront Visits
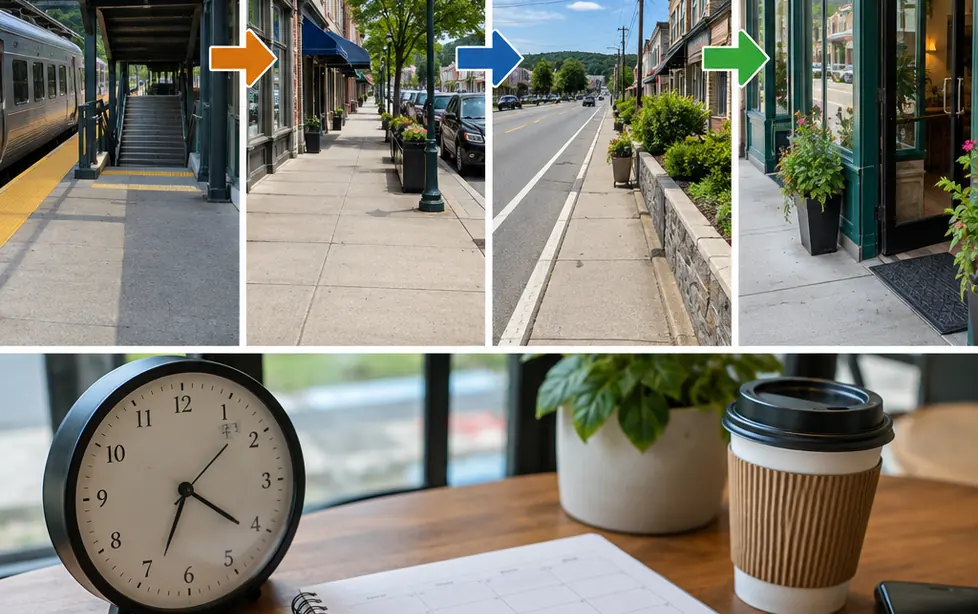
Tracking how transit riders interact with local shops requires a structured four-stage Ossining station-to-storefront funnel separating overpass exits, lower Main Street and Westerly Road corridor pass-bys, threshold crossings, and timestamped register closures. A person counted at one stage of this sequence must never automatically be carried forward to the next. Each transition represents a distinct behavioral hurdle that merchants and urban planners must observe independently.
Structuring the Four-Stage Observation Sequence
- Station-area pedestrian movement: Tallies of individuals exiting the station overpass and stairwells onto public sidewalks.
- Corridor pass-bys: Pedestrians walking directly past the facade of participating storefronts along lower Main Street, Westerly Road, or Quimby Street.
- Storefront entry: Customers physically crossing a retail threshold or stepping up to an exterior service window.
- Completed purchase: Customers who conclude a visit with a verified point-of-sale transaction.
To isolate rail-driven pulses from general plaza circulation, data collection relies on matched 20-minute observation blocks scheduled around morning peak departures (06:00 to 09:00) and evening peak arrivals (16:30 to 19:30). Analysts must evaluate morning outbound flows and evening homebound flows as separate environments without assuming either window naturally produces higher retail spending. Morning travelers operate under rigid train departure deadlines, whereas evening returnees may face household commitments or fatigue.
Drawing on a review of timetable synchronization protocols, the methodology pairs these train-linked windows with 20-minute control observation periods conducted during mid-day off-peak gaps (10:30 to 14:30) under matching precipitation and temperature conditions. Every field log must also document external variables that distort pedestrian flow, including sudden weather shifts, individual store operating hours, train delays, and major gatherings like the Ossining Village Fair.
When Commuter Visits Become Retail Revenue
Foot traffic inside a shop only strengthens the local economy when browsing converts into sustainable store revenue. By aggregating point-of-sale receipt timestamps into 15-minute bands, analysts can test whether transaction volume clusters immediately following Hudson Line train doors opening. However, researchers must never declare peak spending hours in public reports without verified local register records backing those claims. Furthermore, comparative tracking across about 8 to 12 weeks can help separate genuine rail-linked purchasing from seasonal warm-weather shifts along the Hudson River shoreline.
A thorough commercial evaluation examines four distinct financial records, because each metric tells a different operational story:
- Transaction count: The raw number of individual receipts closed during a 15-minute or 20-minute band, indicating how many customers the counter processed.
- Average purchase value: The typical dollar amount per receipt, showing whether time-pressed travelers buy single low-cost items or larger bundled baskets.
- Product mix: Itemized register records revealing whether demand centers on grab-and-go beverages, prepared dinner components, or specialty retail goods.
- Repeat custom: Loyalty card scans or consistent purchasing patterns across consecutive weekdays that demonstrate habitual patronage rather than one-off curiosity.
Analysts must maintain a sharp distinction between total store sales recorded during a train arrival window and sales directly attributable to rail commuters. A register closure occurring five minutes after the 18:15 train arrives does not prove the buyer stepped off that train; a local resident walking a dog along the riverfront generates an identical timestamp. Finally, rather than applying speculative regional multipliers to gross receipts, financial reporting should evaluate net store contribution after deducting variable packaging costs, food spoilage, and incremental hourly payroll.
Retail Tests for Train-Linked Shopping Windows
When independent proprietors consider adjusting their operations to capture commuter trade, the primary hurdle is financial exposure. Expanding store hours or hiring early-morning counter staff carries immediate payroll costs before a single additional customer walks through the door. To protect small merchants, practical retail experimentation sequences operational tests by low cost and high reversibility, verifying customer demand during existing hours before committing to structural schedule expansions.
Sequencing Low-Risk Storefront Adjustments
Merchants can choose from several targeted adjustments suited to their specific business category:
- High-visibility hours signage: Posting clear, illuminated opening and closing times readable from across the street so passing travelers know when the shop serves early or late riders.
- Streamlined collection points: Dedicating a specific counter zone for rapid pickup so customers with limited time bypass slower browsing queues.
- Curated convenience selections: Grouping a small assortment of portable items drawn from the store’s existing inventory near the register.
For morning trade between 06:00 and 09:00, a coffee shop or bakery might test a ready-to-collect pre-order shelf—provided the business category and baseline observation logs indicate genuine morning demand. For returning evening travelers between 16:30 and 19:30, a specialty grocer or food purveyor should focus on rapid order collection before closing rather than assuming tired commuters want an extended evening browsing experience. In both scenarios, merchants should aim for target service completion times under 90 seconds for pre-staged morning pickup items or evening commuter collection orders.
Discipline is essential when running these trials. Proprietors should test a single operational change at a time across a defined trial period lasting about 14 to 21 consecutive weekdays before altering store routines again. Prior to launching the test, the merchant must specify the exact success metric—such as net completed purchases during the target 20-minute window or positive dollar contribution after covering incremental packaging and labor costs—and benchmark the results against comparable pre-test trading periods.
Chamber Programs & Advocacy Safeguard: Isolate one operational variable across roughly 14 to 21 consecutive weekdays and verify net margin contribution before taking on permanent early-morning or late-evening payroll commitments.
Accounting for Waterfront Retail Support
Evaluating whether commuter-focused initiatives genuinely strengthen waterfront businesses requires accounting for the full cost of the effort, not just the register receipts. Well-intentioned pilot programs often appear profitable on paper simply because organizers omit unpaid merchant labor, donated printing, or volunteer coordination from the balance sheet. A transparent reporting ledger prevents this distortion by tracking every resource invested alongside the resulting retail outcomes.
To maintain strict financial clarity, the proposed accounting framework divides program inputs into four distinct ledger categories:
- Chamber expenditure: Direct organizational outlays for printed signage, shared promotional materials, or professional data preparation.
- Retailer expenditure: Private merchant outlays for inventory staging, point-of-sale adjustments, packaging, and paid employee hours during extended trading windows.
- Donated services: In-kind professional contributions, such as graphic design for storefront placards or spreadsheet setup provided without fee.
- Volunteer time: Uncompensated hours contributed by community members conducting pedestrian tallies or proprietors performing manual data entry, tracked in 15-minute increments.
Rigorous recordkeeping requires separating hypothetical planning templates from verified historical actions. No report or ledger should ever imply that a civic expenditure, external grant, formal partnership, or merchant contribution has occurred without documented receipts and time logs backing the entry. Furthermore, ledger reconciliation cycles spanning around 30 to 45 days following the close of any trial observation period give bookkeepers and shop owners sufficient time to verify actual invoices against point-of-sale reports.
Every accountable entry in the support ledger must contain six core elements: the specific activity performed (such as pedestrian counting or signage installation), the responsible party, the exact reporting period, the documented dollar cost or time logged in 15-minute increments, the intended retail outcome, and the documented result.
Start a Waterfront Commuter Purchase Log
Before designing elaborate marketing campaigns or altering staff schedules, waterfront proprietors can take one immediate, practical step to test whether station-linked movement produces purchases worth serving: place a four-column commuter purchase log beside the point-of-sale register for the next 5 to 10 consecutive weekdays (Monday through Friday).
Set up a single sheet of paper or a simple digital spreadsheet with four fields that a solo clerk can mark in seconds during a shift:
- Trading window: Note the specific 20-minute train-linked or mid-day control window (for example, 07:10–07:30 or 17:45–18:05).
- Completed purchases: Tally each closed register transaction completed within that window.
- Commute connection (optional): Mark a check when a customer answers yes to the brief verbal prompt asking if today’s stop is part of a train trip, leaving the column blank whenever a rush prevents asking.
- Unusual trading conditions: Jot down a brief note on heavy rain, service disruptions, or local street closures affecting that specific block of time.
Run this log across a full five-to-ten-day workweek cycle, total the confirmed transactions alongside your standard register tapes at the end of Friday’s shift, and use those verified baseline numbers to decide whether an operational pickup test lasting close to 14 days makes financial sense for your storefront.















Join the Discussion